home | links | compass

Subjectivity–Objectivity
complementarity needed for
collaborative intelligence
Subjectivity – our diverse
POVs and interpretations
Objectivity – the facts of
the world we interpret
LINKS
References
Gephi Graph Viz
MESUR
Microbes–Mind Forum
Planet Innovation
SMR Foundation
von Ahn on Human
Computation
AI Conferences
Animating Time Data
Climate Collab
Darwin papers
Do Some Good
EO Wilson Foundation
Gapminder
Geo-tagger's World Atlas
Howe on Crowdsourcing
Innovation Networks
IRIDIA
Kelly - Hivemind
Kirschner Lab
London Open Street Map
Los Alamos – Symbiotic
Intelligence
Mechanical Turk
MIT Center for
Collective Intelligence
Recommender Systems
SETI @ Home
SIGCHI
SIGEVO
SIGGRAPH
Turner Fieldwork
Vinge on Singularity
Wall Street Journal
BOOKS
![]()
Ehrlich - Humanity
on a Tightrope
![]()
Kelly – What
Technology Wants
![]()
Axelrod – Evolution
of Cooperation
![]()
Axelrod – Complexity
of Cooperation
![]()
Hansen, Schneiderman,
Smith – Analyzing Social
Networks - Node XL
![]()
Surowieki_
Wisdom of Crowds
![]()
J Fodor & M P
What Darwin Got Wrong
![]()
E Jablonka & M Lamb
Evolution in 4D
![]()
M Kirschner & J Gerhart –
Plausibility of Life
![]()
J Scott Turner
Tinkerer's Accomplice
![]()
J Scott Turner
The Extended Organism
![]()
MJ West-Eberhard –
Developmental
Plasticity & Evolution

Image Credit above
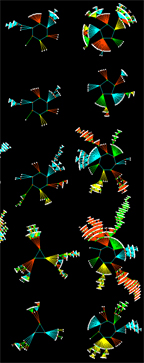
Andrew Wuensche, DDL
Random Boolean Networks
Next generation social networks as innovation networks |
|
||
 |
In Mapping Change in Large Networks Martin Rosvall and Carl T. Bergstrom examine a set of scientific fields that show the major shifts in the last decade. Significance clusterings for citation networks in 2001, 2003, 2005, and 2007 columns in the diagram are horizontally connected to preceding and succeeding significance clusterings by stream fields. Each block in a column represents a field and the height of the block reflects citation flow through the field. Fields are ordered from bottom to top by their size. A darker color indicates the significant subset of each cluster, e.g. all journals clustered in the field of neuroscience in year 2007 are colored to highlight the fusion and formation of neuroscience. Rosvall and Bergstrom argue that "change is a fundamental ingredient of interaction patterns in biology, technology, the economy, and science itself: interactions within and between organisms change; transportation patterns by air, land, and sea all change; global financial flow changes; and the frontiers of scientific research change. |
|
In January 2011, LinkedIn announced a new application called InMaps. Users can visualize their LinkedIn Network(s) to better leverage their networks and to identify potential to strengthen and extend them. D.J. Patil, Chief Scientist of LinkedIn commented on how InMaps augments their Career Tree. Microsoft's NodeXL extension makes it easy to extract, analyze and visualize social media networks. NodeXL can connect directly to social networking website, such as Twitter, to import its network data for analysis in Excel. As an example, the diagram below shows people who tweeted the word Wikileaks on December 10, 2010. Using NodeXL, you can import network data of people who have recently tweeted any term that interests you.  from Derek Hansen, Ben Schneiderman & Marc Smith Analyzing Social Networks with Node XL: Insights from a Connected World |
||
|
||
 |
Social network analysis software is used to recognize patterns in the interactions and relationships between individuals or organizations. Typically individuals or organizations are represented as nodes and interactions or relationships as edges. |
|
|
||
 |
The outer ring on the map [black nodes] are actual properties in Cleveland and NE Ohio with failed mortgages. |
|
|
||
From micro level cellular mechanisms to macro level population genetics, evolution manifests a coordinated, multi-level Dyadic Model for innovation that next generation social networks could apply in decision support systems for eco-sustainability. Exponential acceleration of technology innovation extends the acceleration of biological evolution, posing challenges and opportunities. Competing hypotheses about the origin and evolution of life show nature’s adaptive mechanisms, evolvability, and the algorithmic implications of evo-devo debates, and also suggest a new collaborative computing paradigm, which can increase the effectiveness of human teams as “evolving, multi-agent ecosystems,” harnessing evolutionary principles to increase our collaborative intelligence. Our current, conventional problem-solving model, based primarily upon “analysis of the facts,” is inappropriate for many of the problems we face today, which require a systematic (design) approach to synthesis and ways to acknowledge the role that human perception of the facts, and capacity for pattern recognition, plays in problem-solving. Problem mapping a priori, in contrast to information visualisation after-the-fact, generates visual frameworks, or “empty constructs” to structure the process of knowledge-gathering. Problem maps can evolve into navigable user interfaces. These open frameworks (partial patterns) tap the pattern recognition capabilities of users, serving as vehicles to order incoming information in process, and for use by participants during the problem-solving process. A classic example of a problem map is Dmitri Mendeleev’s Periodic Table of Elements, which prompted chemists to look for elements that appeared logically likely to exist, based upon the pattern of the Table. |
||
|
||
Sustainability is the optimisation of tradeoffs to maximise environmental stewardship within the context of project planning priorities and, as defined by the Brundtland Commission, “the needs of the present without compromising the ability of future generations to meet their own needs.” |
||
|
||
|
||