home | links | compass

Subjectivity–Objectivity
complementarity needed for
collaborative intelligence
Subjectivity – our diverse
POVs and interpretations
Objectivity – the facts of
the world we interpret
LINKS
References
von Ahn on Human
Computation
AI Conferences
Animating Time Data
Climate Collab
Darwin papers
Gapminder
Geo-tagger's World Atlas
Innovation Networks
Kirschner Lab
London Open Street Map
Microbes–Mind Forum
MIT Center for
Collective Intelligence
Planet Innovation
Recommender Systems
SIGCHI
SIGEVO
SIGGRAPH
Vinge on Singularity
Wall Street Journal
BOOKS
![]()
Hansen, Schneiderman,
Smith – Analyzing Social
Networks - Node XL
![]()
J Fodor & M P
What Darwin Got Wrong
![]()
E Jablonka & M Lamb
Evolution in 4D
![]()
M Kirschner & J Gerhart –
Plausibility of Life
![]()
J Scott Turner
Tinkerer's Accomplice
![]()
J Scott Turner
The Extended Organism
![]()
MJ West-Eberhard –
Developmental
Plasticity & Evolution
Problem-mapping & |
|
|
Problem mapping tracks the status of collaborative problem-solving. Visualization of problem information needs to be complemented by visualization of the problem-solving process. Information visualization goes beyond viewing static data to enable users to collaborate to manage and update their problem-solving environment, offering simple ways to navigate through information so the user can see where he and other users are on a map of their collaborative problem-solving process.
|
|
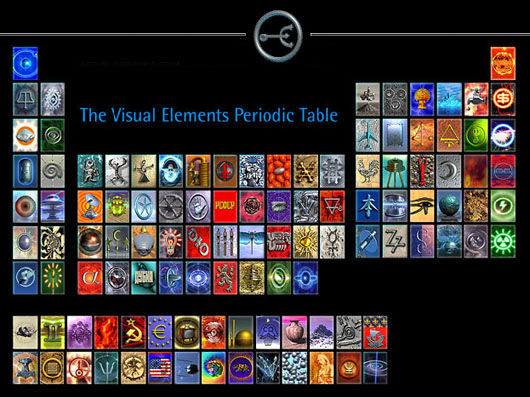
| Background on Problem Mapping. Problem mapping a priori, creates conceptual geographies, enabling problem-solvers to see where they are in a group problem-solving process, in contrast to information visualisation after-the-fact, generates visual frameworks, or empty constructs to structure the process of knowledge-gathering. The diagram above contrasts with traditional information visualization. A classic example of a problem map is Dmitri Mendeleevís Periodic Table of Elements, which prompted chemists to look for elements that appeared logically likely to exist, based upon the pattern of the Table. |
|
The confusion of elements before Mendeleev’s Table of Elements existed illustrates how seemingly disordered information contains implicit structure, the starting point for Mendeleev’s conceptual breakthrough. The Table in turn provided the next level of implicit structure — an intellectual framework through which implicit pattern could be recognised and made explicit. The Periodic Table is a classic model, showing how “empty constructs” facilitate knowledge-building. |
|
|
|
Practical Applications. Our current, conventional problem-solving model, based primarily upon “analysis of the facts,” is inappropriate for many of the problems we face today, which require a systematic (design) approach to synthesis and ways to acknowledge the role that human perception of the facts, and capacity for pattern recognition, plays in problem-solving and rapid response. One example of the type of large-scale collaborative process that requires collaborative intelligence: the US Geological Survey (USGS) predicted in 2003 a 62% chance of a Bay Area earthquake of 6.7 or greater on the Richter scale within 30 years (USGS Fact Sheet, 2003). Los Angeles was predicted to experience a similar large earthquake with even worse consequences. Such an earthquake could be large enough to generate system-wide effects with escalating and cascading side-effects: water supply mains broken; transportation routes destroyed or blocked; landslides; food and water shortages, with consequences for everybody in these regions. The USGS Land Use Portfolio Model helps communities assess risk in a holistic way. (Bernknopf et. al. 2006). Tools under development encourage individuals, organisations, and whole communities to assess and prepare for risks. But realtors don't want to hear, or relay, a forecast that might adversely affect property values. Politicians don't want to know, if the forecast requires expending budget to initiate protective measures. The challenge for USGS is how to design a game-like environment to attract participation and speculation about the consequences, a game to increase awareness and preparedness. Possible scenarios to enlist proactive participation are tried through gaming techniques. Information gathered from distributed agent or sensor systems is raw material for analytics and knowledge synthesis. Geo-mapping could prepare rapid responder teams in advance for some aspects of the next big California earthquake. But major data collection and interpretation must necessarily occur post-event. What that post-event will look like is as unpredictable in advance as was Hurricane Katrina. A proactive experiment by USGS to motivate citizen participation in scenario-building employed geo-mapping to support spatial decision-making and knowledge synthesis through time. Each player, from her own unique perspective asks, What information do I need to assess my risks associated with this property purchase? Perception of risks is as relevant to behavior as probabilities of losses. Since individuals differ in their perception of risks, and their assessment of the costs of preparedness, this experiment becomes a way to survey public perception (Bernknopf et. al. 2003).
|
|
Innovation (or Knowledge) Networks link participants, while maintaining their uniqueness and collaborative autonomy such that knowledge can evolve as networks grow, with potential for emergent, unpredictable patterns and innovative outcomes. |
|
|
|
Sustainability is the optimisation of tradeoffs to maximise environmental stewardship within the context of project planning priorities and, as defined by the Brundtland Commission, “the needs of the present without compromising the ability of future generations to meet their own needs.” |
|
References. |
|
|
|